
Global Unicorn Club Analysis using Power BI
Did you know:
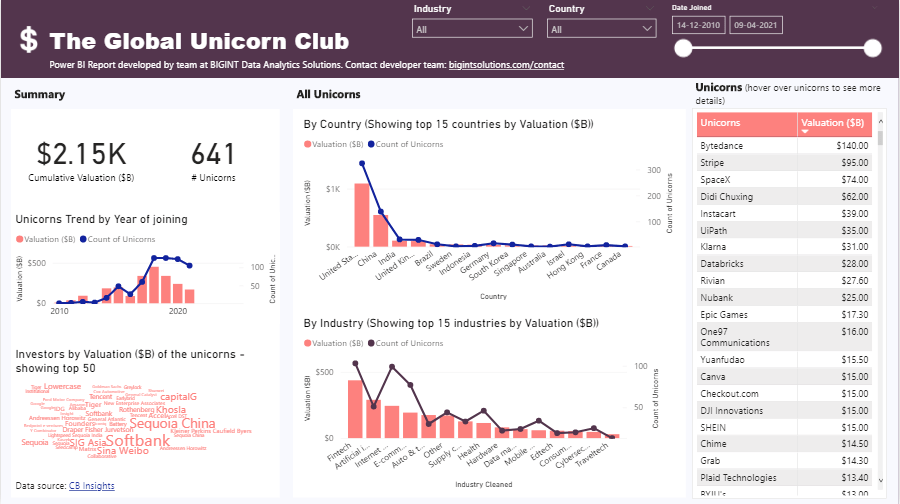
- There are 641 Unicorns with a cumulative valuation of close to USD 2.15K billion
- US contributes close to 50% from these 501 unicorns, with China contributing 25%, India 5% and UK 5%. That makes the total 85%.
- India, China, United Kingdom and Germany are top 4 countries for emerging unicorn clubs apart from US
- Fintech, Internet Software and Services, E-commerce & direct-to-customers and Healthcare are emerging industries of Unicorns?
- In the last 5 months (as of today April 14, 2021), 141 companies have become Unicorns. Nine of them are from India.
From India, the companies are: CRED, Meesho, ShareChat, Digit Insurance, Five Star Business Finance, Cars24, DailyHunt, Groww, Infra.Market
Stats last updated: April 14, 2021
Unicorn Analysis
A unicorn is a privately held company with valuation of more than $1B (USD 1 billion).
How were we able to get this kind of analysis from the Unicorn list?
We extracted the data from the web using Power Query and modeled and created an interactive report using Power BI. Analysis was performed to understand Unicorn trends from multiple dimensions.
We analyzed:
- Overall Unicorn Summary with year wise trends
- Overall unicorn companies distribution by geography and industry
- Top 10 views by Investors and Industry
- Investor Cohort by valuation ($B) of the companies they invested in
- Emerging trends by analyzing the companies joining the list in last 1 year
- Which industry/country is going to take over in future?
Please head to our Power BI report that we have hosted for detailed analysis. Play with it and let us know what you think about it.
Unicorn club Power BI Report
The report has following main tabs.
- Unicorn Club Summary
- Emerging Unicorn Club Summary
- Valuation $ Decomposition (Power BI AI Visual)
- Top 10 views
- Investor Industry Heatmap
- Investor Country Heatmap
- Unicorn List
You can filter the reports by Industry, Country, Investor and Date Joined.
Unicorn Club Summary:
This page shows an overall summary of the Unicorns with distribution by unicorn country and industry.
Emerging Unicorn Club Summary:
All unicorns joined in the last 1 year. We analyze emerging unicorns to understand hot industries, countries, and investors.

Valuation $ Decomposition
In this visual we decompose the valuation ($B) and break it down by Country, Industry and Investor to have a tree like visual.

Top 10 views – interesting views
This report tab shows top investors and industry. You can hover over the cell values to find Unicorns in that cohort. You can also cross filter to see Unicorns of the selected investor and industry.

Heatmaps – Investor-Industry, and Investor-Country
Get a glance of which industry and country investors are putting their money.

The report also provides you drill-through capabilities. Ex: if you want to see which companies from India have joined the Unicorn list in the last year, right-click on “India” on the visual “From countries (top 5 based on valuation)”, click on “Drillthrough” and select report “Unicorn List Drillthrough”. This will open another report with all the filters applied.

The filtered drill-through report.

Unicorn Club List
View the entire Unicorn list with Industry, Country and Date Joined filter. From the Date Joined filter you can select relative dates, ex: Last 1 month will give list of unicorns that joined the list in the last 1 month.

What other interesting insights did you find from our report?
Access Live Power BI Report below (best viewed in full screen mode – click on the expand icon on bottom right corner)
Note: The data for the Global Unicorn list has been taken from CB Insights. For Raw data, please head to their website.
Thank you,
Ranbeer Makin
Contact us if you need enhancements to current report or you need similar analysis of your data.